


Are you looking to harness the power of Elasticsearch, Logstash, and Kibana for effective log management and data analysis?
This step-by-step guide will walk you through the process of installing and configuring this powerful trio on Amazon Linux 2023. Elasticsearch enables lightning-fast searches and data storage, Logstash efficiently processes logs, and Kibana delivers stunning visualizations. Let's dive right in!
Prerequisites:
Amazon linux 2023
enable security group "all traffic"
2 CPU and 4gb RAM (t3.medium or t2.large)
Step 1: Installing Elasticsearch
Install Java 11:
sudo yum install java-11 -y
Configure the Elasticsearch repository:
https://www.elastic.co/guide/en/elasticsearch/reference/current/rpm.html
Create a repo for Elasticsearch using vi/etc/yum.repos.d/elasticsearch.repo
vi/etc/yum.repos.d/elasticsearch.repo
[elasticsearch]
name=Elasticsearch repository for 8.x packages
baseurl=https://artifacts.elastic.co/packages/8.x/yum
gpgcheck=1
gpgkey=https://artifacts.elastic.co/GPG-KEY-elasticsearch
enabled=0
autorefresh=1
type=rpm-md
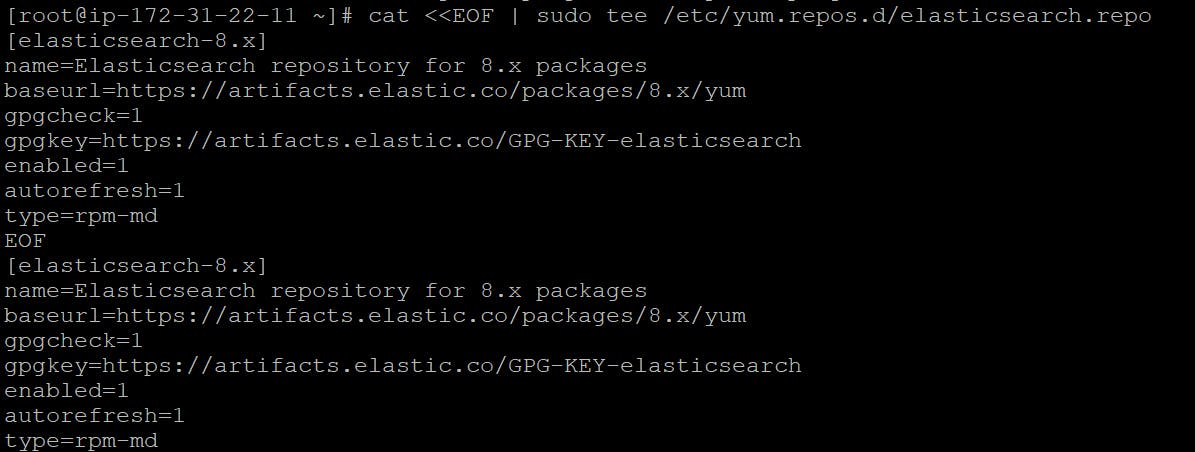
To verify :
cat /etc/yum.repos.d/elasticsearch.repo
Import the GPG key:
sudo rpm --import https://artifacts.elastic.co/GPG-KEY-elasticsearch
Update and refresh the repository:
 sudo yum clean all
 sudo yum makecache
Install Elasticsearch on Amazon Linux 2023.
sudo yum -y install elasticsearch
Verify that Elasticearch has been installed successfully:
rpm -qi elasticsearch
Start and enable the Elasticsearch service:
 systemctl start elasticsearch.service
 systemctl enable elasticsearch.service
Configure Elasticsearch on Amazon Linux 2023
After the installation, you may need to configure Elasticsearch. Edit the file
/etc/elasticsearch/elasticsearch.ymlUpdate the
network.hostto0.0.0.0andhttp.portto9200and modifydiscovery.seed hosts:[].To disable security features, setxpack.security.enabled: false.vi /etc/elasticsearch/elasticsearch.yml
Restart Elasticsearch:
systemctl restart elasticsearch.serviceVerify service status

Testing Elasticsearch:
Lets test Elasticsearch using curl command by sending HTTP request
curl -X GET "localhost:9200"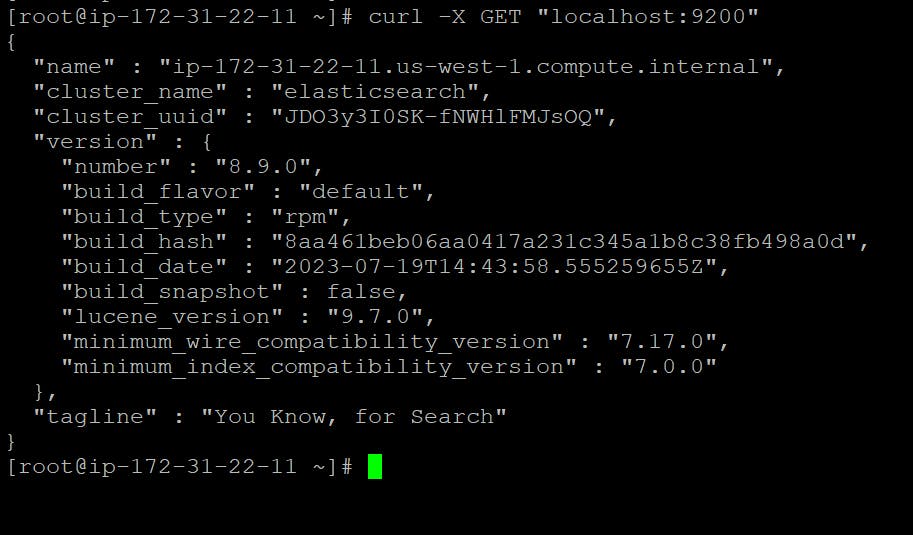
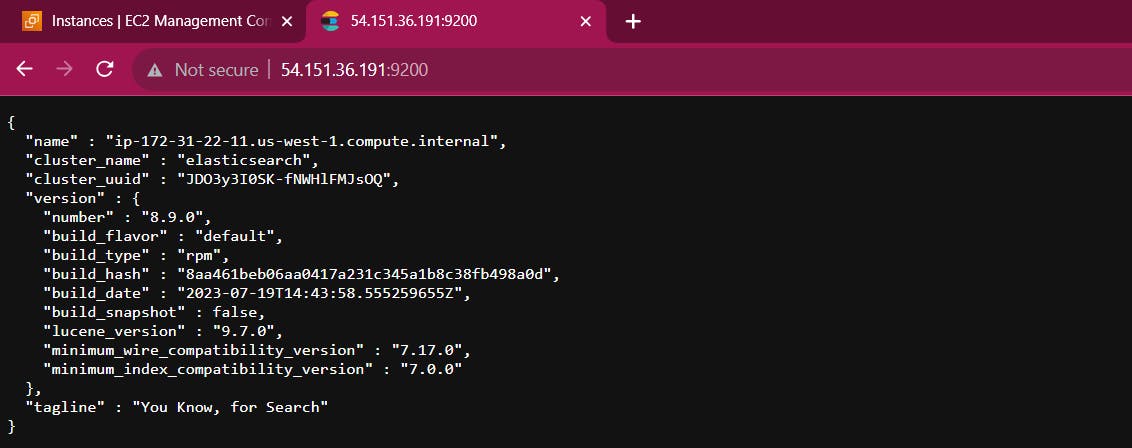
To check browser <Instance publicip>:9200
Step 2: Installing Logstash
After a successful installation and configuration of Elasticsearch on Amazon Linux 2023, we now proceed to the next element, which is Logstash.
Install Logstash:
sudo yum install logstash -y
Edit the Logstash configuration file to add the input and output parameters.
vi /etc/logstash/conf.d/logstash.confpaste:
 input {

   beats {

     port => 5044

   }

 }
 output {

   elasticsearch {

     hosts => ["localhost:9200"]

     manage_template => false

     index => "%{[@metadata][beat]}-%{[@metadata][version]}-%{+YYYY.MM.dd}"

   }

 }
Start and enable the Logstash service:
 systemctl start logstash.service
 systemctl enable logstash.service
 systemctl status logstash.service
Step 3: Installing and Configuring Kibana
Kibana exists in the ELK repo that we had configured earlier, we shall therefore proceed to install the package directly.
Install Kibana
sudo yum -y install kibanaStart and enable the Kibana service:
 systemctl start kibana.service
 systemctl enable kibana.service
 systemctl status kibana.service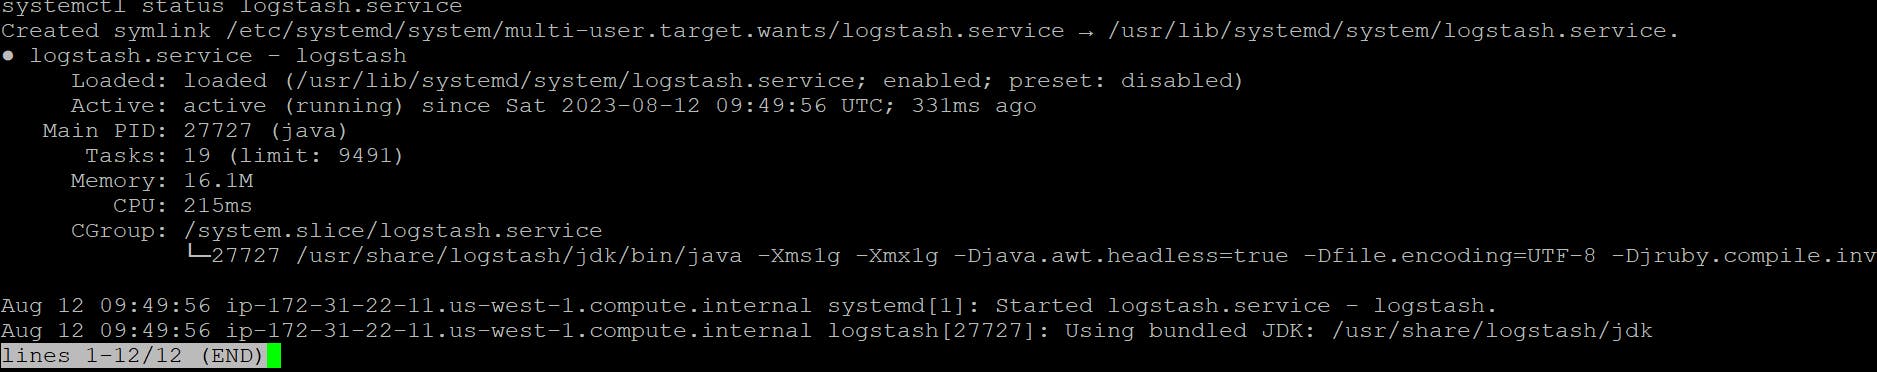
Configure Kibana by modifying
/etc/kibana/kibana.yml. Update uncommentserver.hostto"0.0.0.0"andelasticsearch.hoststo["http://localhost:9200"].vi /etc/kibana/kibana.yml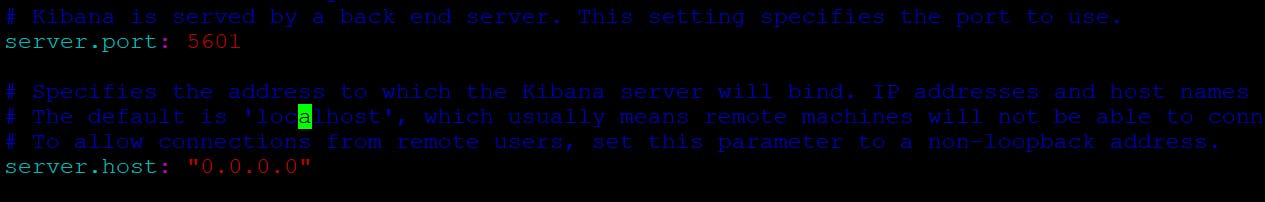

Restart Kibana:
systemctl restart kibana.serviceAccess the Kibana dashboard by
<server-ip>:5601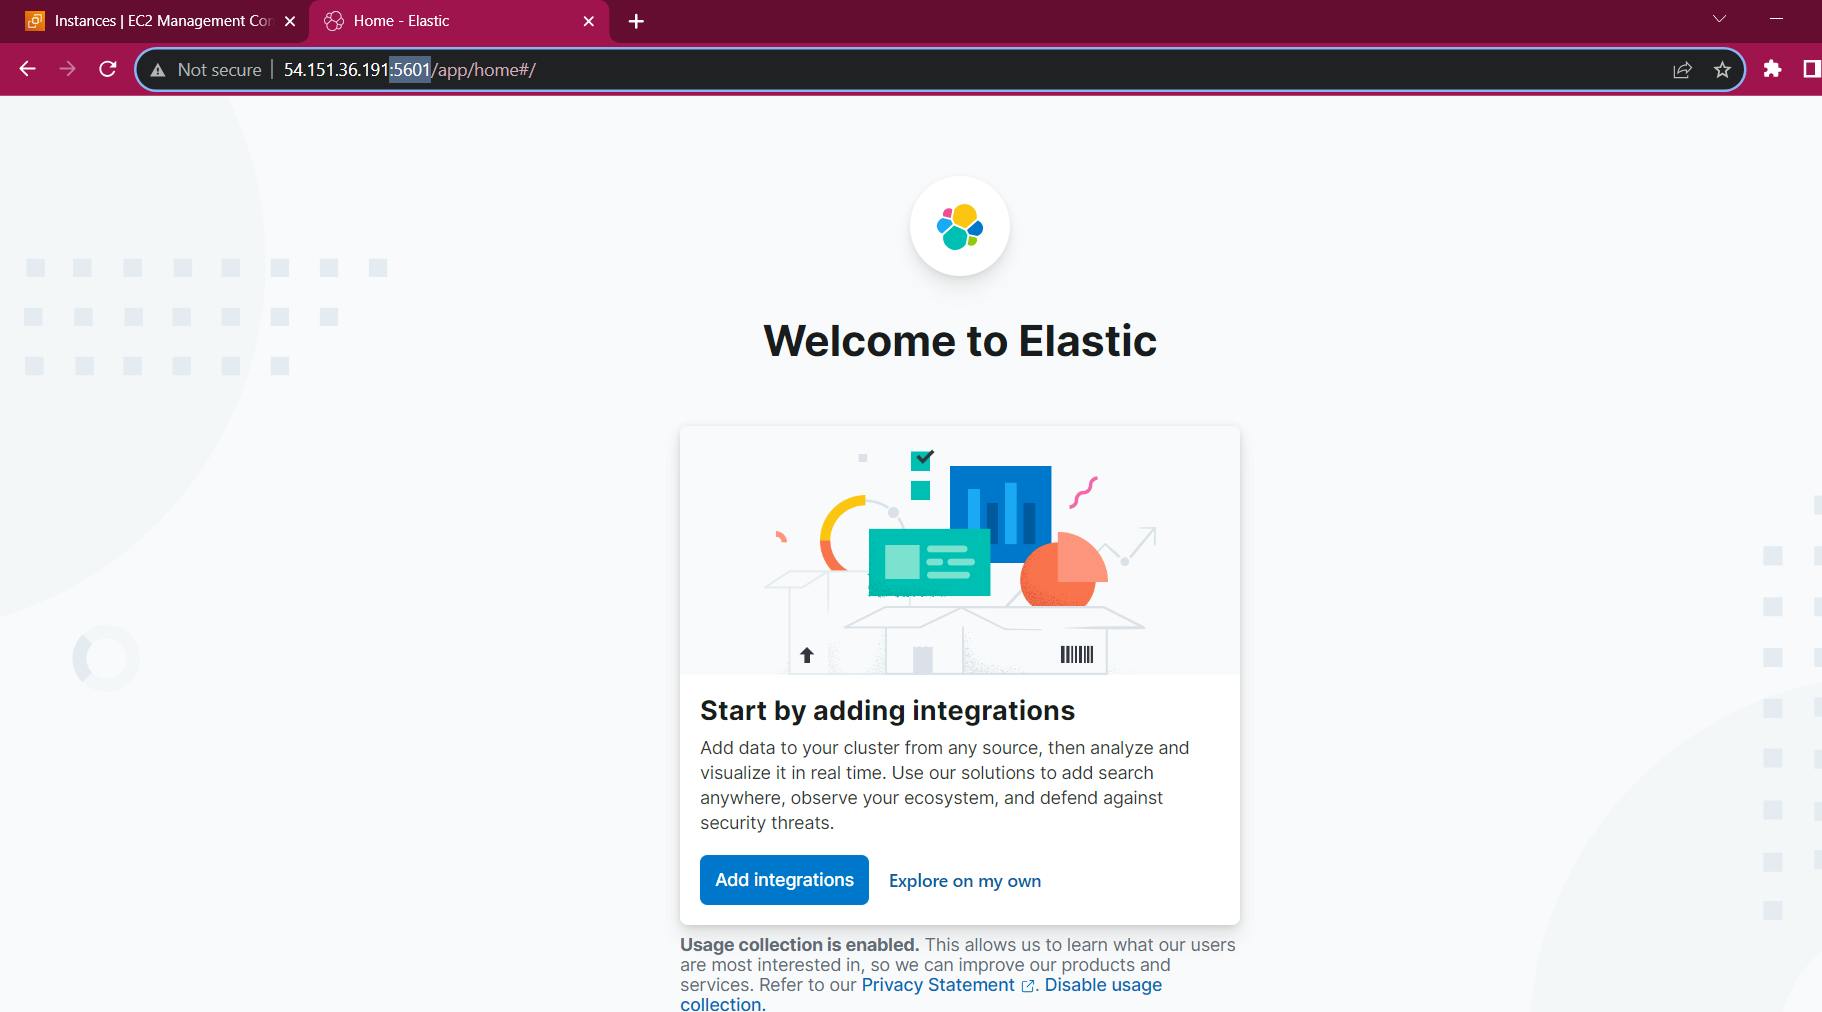
You can now start adding your data and shipping logs using beats such as Filebeat, Metricbeat, etc.
Step 4: Installing and Configuring Filebeat
Install Filebeat:
sudo yum install filebeat -yStart and enable the Filebeat service:
 systemctl start filebeat.service
 systemctl enable filebeat.service
Configure Filebeat
filebeat, by default, send data to Elasticsearch. Filebeat can be also configured to send event data to Logstash
#output.elastic search:
An array of hosts to connect to.
#hosts: ["localhost:9200"]
------------------------------ Logstash Output -------------------------------
output.logstash:
The Logstash hosts
hosts: ["localhost:5044"]
open configuration file follow below command:
vi /etc/filebeat/filebeat.yml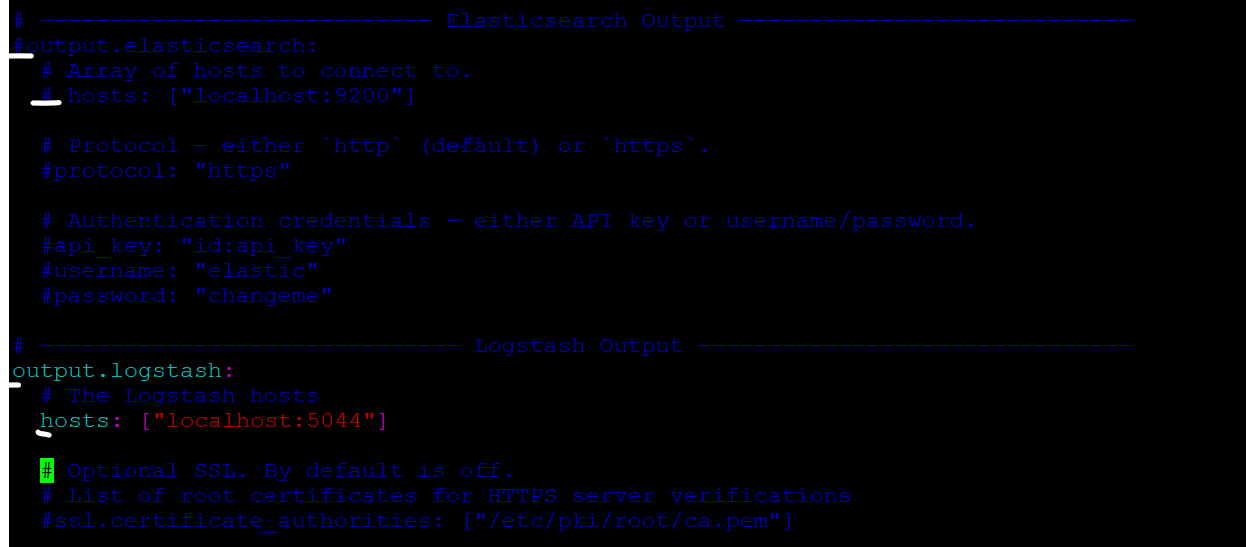
Restart Filebeat:
systemctl restart filebeat.serviceEnable modules for Filebeat. This enables the applications that will ship their logs to Elasticsearch. To check the available modules, run the command below:
sudo filebeat modules listEnable a module, such as the Nginx module:
sudo filebeat modules enable system
Restart Filebeat:
systemctl restart filebeat.serviceload the index template:
note: change the instance IP Address in the template <instance IP:9200>
filebeat setup --index-management -E output.logstash.enabled=false -E 'output.elasticsearch.hosts=["<instance ip>:9200"]'
Start and enable the Filebeat service:
 systemctl start filebeat.service
 systemctl enable filebeat.service
Verify Elasticsearch reception of data:
curl -XGET http://<instance-ip>:9200/_cat/indices?v
To Access browser
<instance-ip>:9200/_cat/indices?v
You're all set! With Elasticsearch, Logstash, and Kibana up and running, you have a powerful platform for managing, analyzing, and visualizing your data. Customize the setup according to your needs, create stunning visualizations, and dive into the world of actionable insights.
Remember, this guide provides a basic setup. For production environments, consider security, scaling, and optimization. Happy analyzing!